


Sports Championship Difficulty Bragging Rights Breakdown
Sports Championship Difficulty Bragging Rights Breakdown
What is the most difficult sports championship to win, and does being great actually improve your chances of winning one?

As we pass the summer solstice each year, the NHL and NBA playoffs are typically winding down or have already ended (shoutout Celtics!), and the beloved question “what sports championship is the most difficult to win?” stops getting asked until the fall. In the spring, NHL pundits usually have a field day declaring that the Stanley Cup is the most difficult trophy to win in all of sports. But is that actually true? When it comes down to it, what percentage of players in each major sport (MLB, NBA, NFL, NHL) actually win a championship during their careers?

The easiest way to estimate an athlete’s chances of winning a championship in a given league is to look at the number of teams in a league and the average career duration of a player. If a completely unique set of players win a championship every year, you have a 1/(# of teams in a league) chance to hoist a trophy in a given year, and to estimate the total chance of winning it over the course of a career, you can multiply by the average athlete career duration. For each of our major leagues, you get the following math:
MLB: Teams: 30 | Average career: 5.6 years | Chance to win league: 18.7%
NBA: Teams: 32 | Average career: 4.5 years | Chance to win league: 14.1%
NFL: Teams: 32 | Average career: 3.3 years | Chance to win league: 10.3%
NHL: Teams: 32 | Average career: 5.5 years | Chance to win league: 17.2%
Each of these values represents the average, maximum chance that a player in today’s leagues has to win a championship, so how does this stack up against the actual percent of athletes that have won a championship in each of these leagues— a simple question right? I thought so, but I was wrong…
It turns out there aren’t any singular, official databases for tracking the number of players that have won a championship (the NHL comes the closest because everyone’s name is on the trophy). Some leagues don’t even have readily available answers for the total number of players who have played in the league during different time periods. This lead me down some unfortunate internet rabbit holes to construct the “actual” data for this article, including pulling custom Google Sheets constructed by Reddit users, copying and cross-referencing MLB rosters from Wikipedia, and even using league demographic studies to just understand how many players have played in certain time periods. (I think) The results were worth it, but due to time and data availability limitations, the time ranges explored for each league are slightly unique, with the details in the footnotes.1
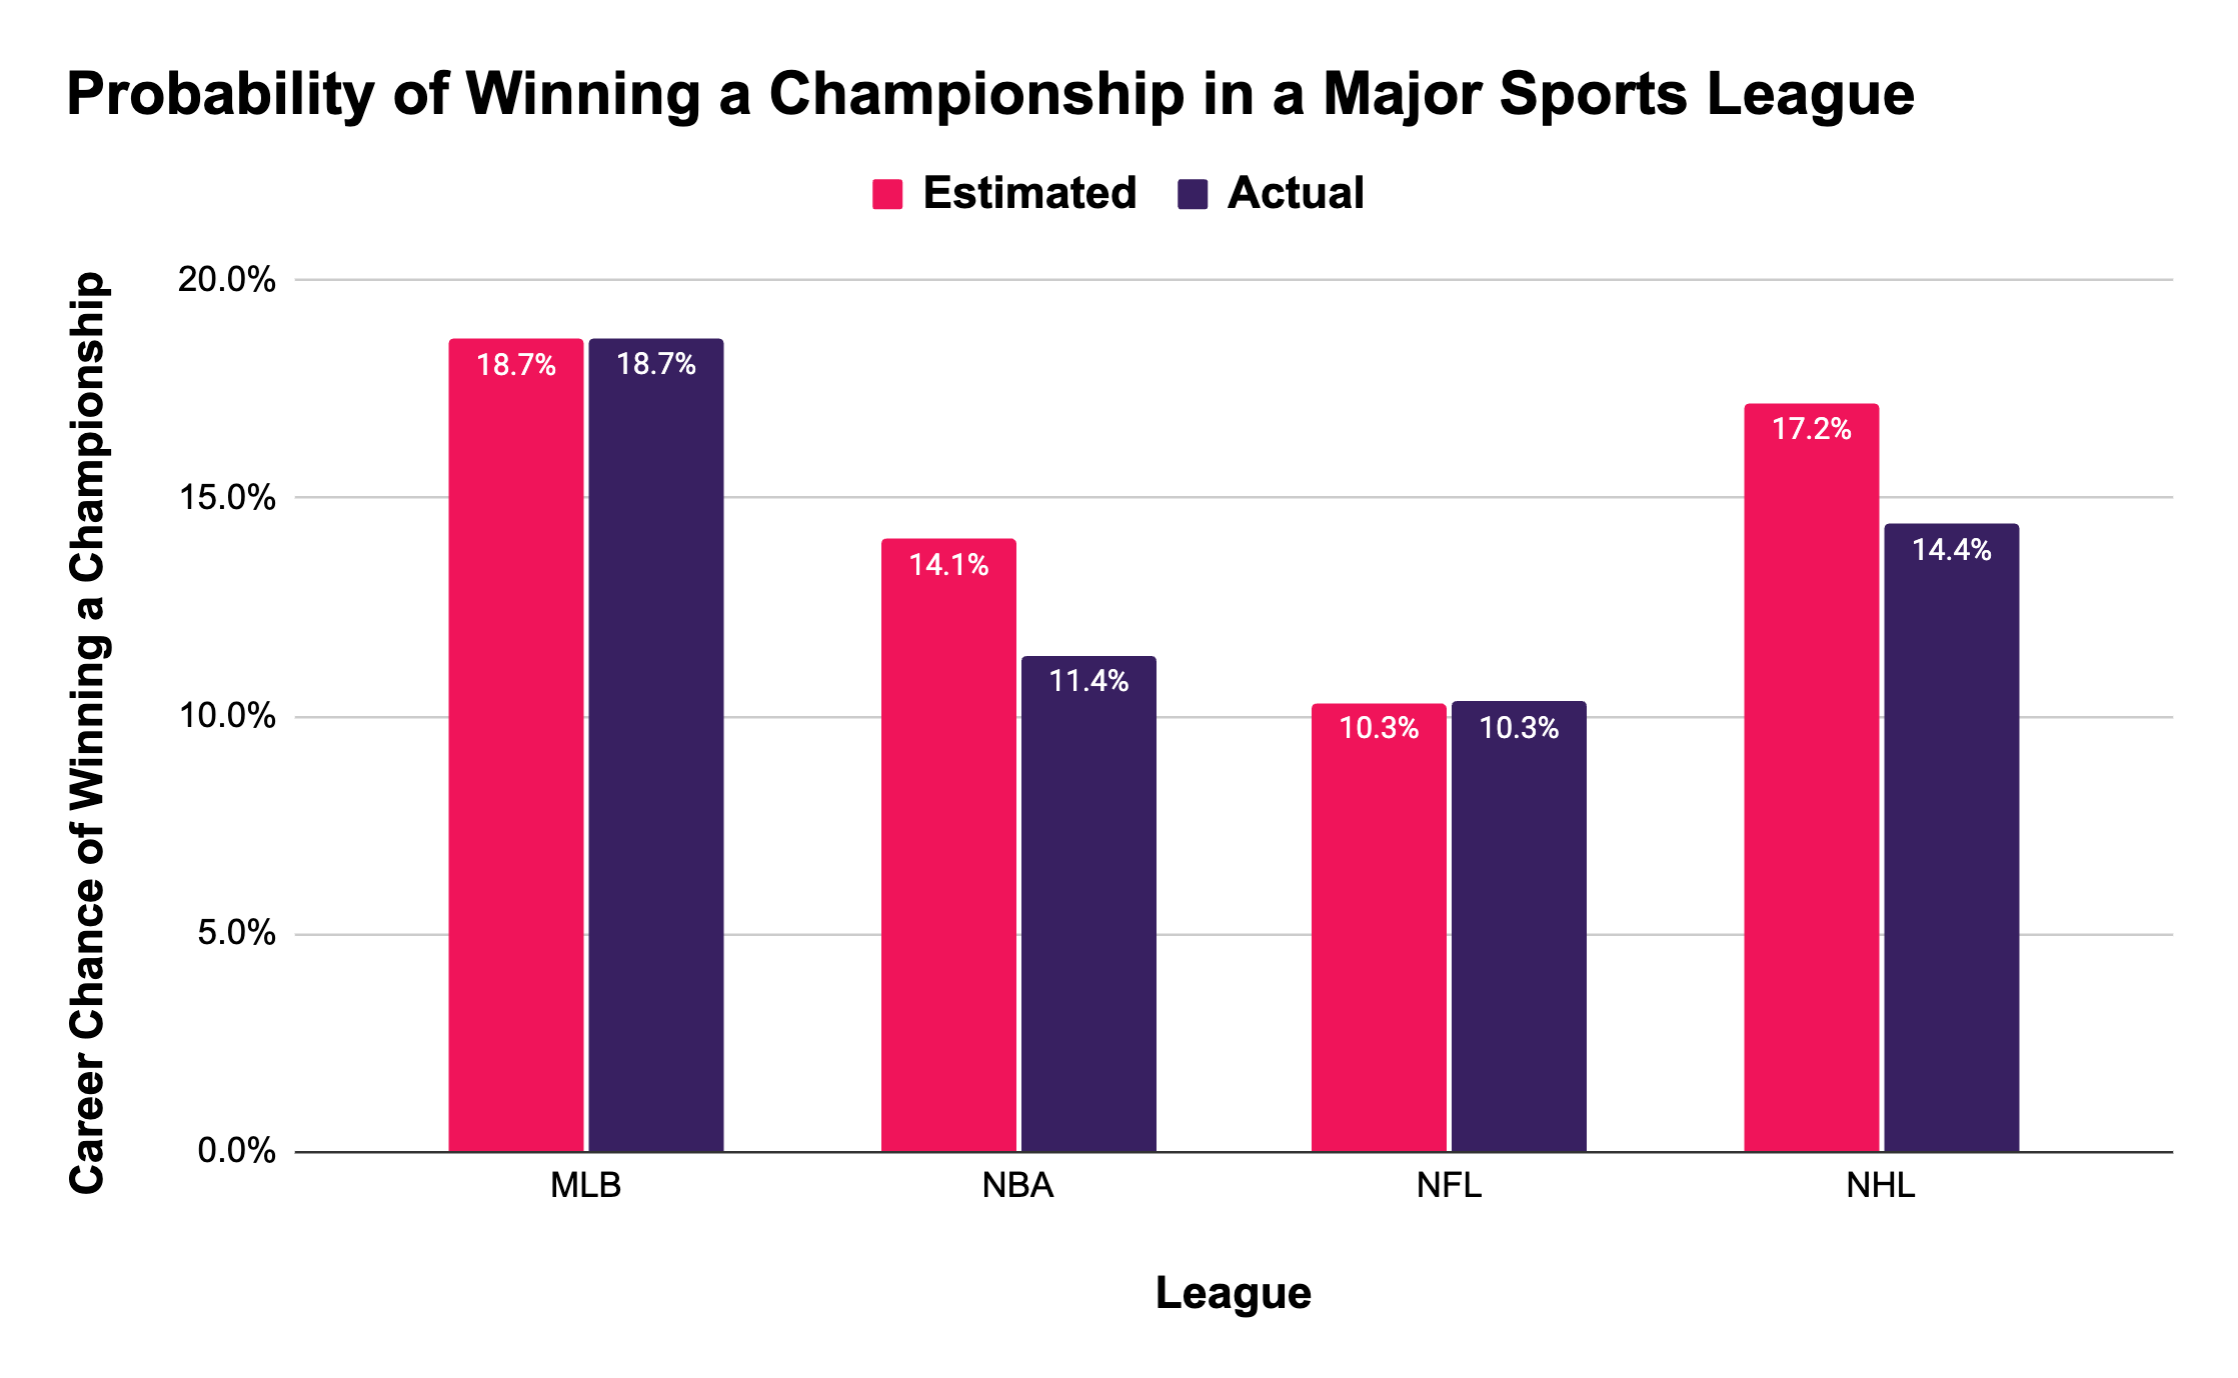
It turns out, the basic estimates from above are quite reflective of actual historical data! The chances of winning a championship in the MLB and NHL are higher than the NBA and NFL, with their shorter average career length. However, there are factors at play here under the surface here that prevent an early celebration (though I do love me some confirmation bias).
First, there are obviously players that win multiple championships, which reduces the overall percentage of players that actually hoist a trophy during their career. I noted earlier that the estimates represent a theoretical maximum for the chance to win a trophy if a new set of players win every year, which clearly does not reflect reality. If there were no other factors at play, the chart above would suggest that the NFL and MLB have the most parity and new players to win every year, while the NHL and NBA have more dominant strings of championships by individual teams and athletes. I actually do think these assertions about league competitiveness are true, but there are additional factors influencing the actual data.
Most notably, each of these leagues has seen a dramatic increase in the number of teams over the years, so the percentage of players that win a championship in a given year has steadily trended downward. As a result, when you look at historical data, the percentage of players who won a championship is slightly inflated. In 1950, there were 16 MLB teams, so your chance of winning a championship in a given year was twice as high as it is now. Conversely, in each of these analyses, there are active players who have not yet finished their careers. This serves to deflate the actual championship win rate as these players have not exercised every shot they have to win it all.
Almost counterintuitively, allowable roster size increasing over time theoretically does not influence the historical championship win rate. Even if the MLB started admitting teams of 5,000 players, as long as every team filled their roster, the percentage of players who win a championship in a given year remains the same, and so does the total. It definitely took me some quick spreadsheet math to actually wrap my head around this fact.
It is entirely possible that other factors come into play as well that could influence these numbers. However, I do think that the impact of smaller teams throughout the history of each league has a greater impact than the number of players in the middle of their career currently, implying that if we took an apples-to-apples analysis approach, your current chances of winning a championship in each sport would be lower than the “actual” historical data that we’ve generated here. So all to say, I think our basic methodology is a strong directional guess at reality, and maybe with some sort of coefficient for repeat winners, you could accurately estimate the chances of winning a trophy in these leagues.
This brings us to a critical question that I teased in the subtitle though: does being great at your sport actually improve your chances of winning a championship? To answer this question, I looked at the top point-scorers of all time in the NHL and the NBA, limiting myself to these leagues and criteria to simplify this first crack at answering the question— there are certainly additional ways this question could be answered. As it turns out, being great at a sport definitely increases your chances of winning a championship, but by no means guarantees that you do:
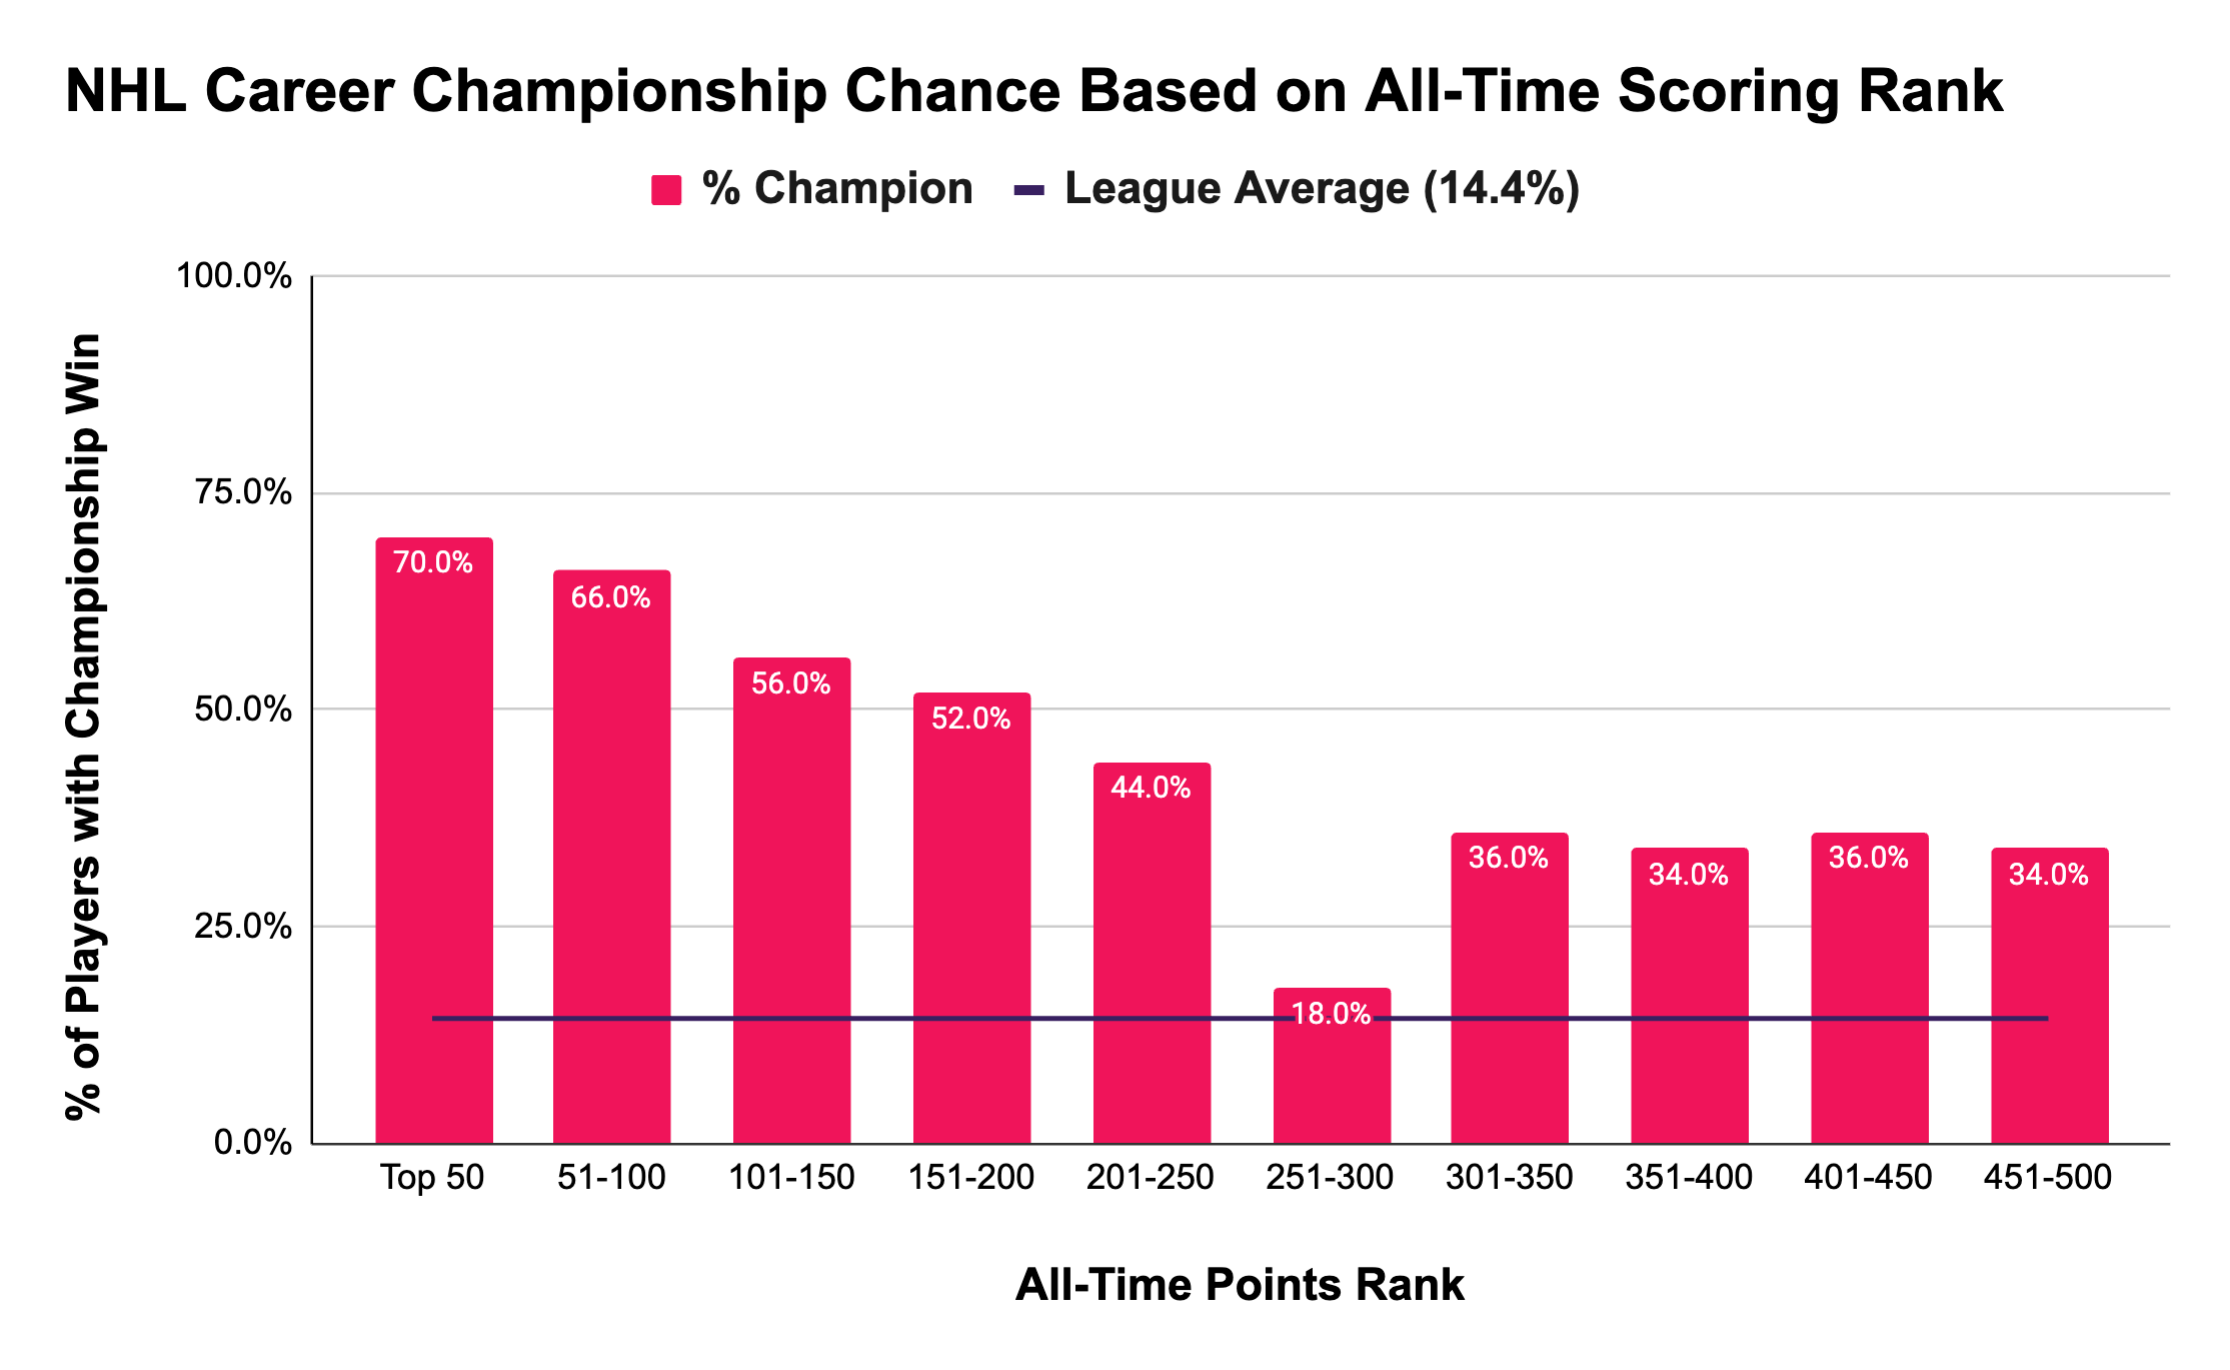
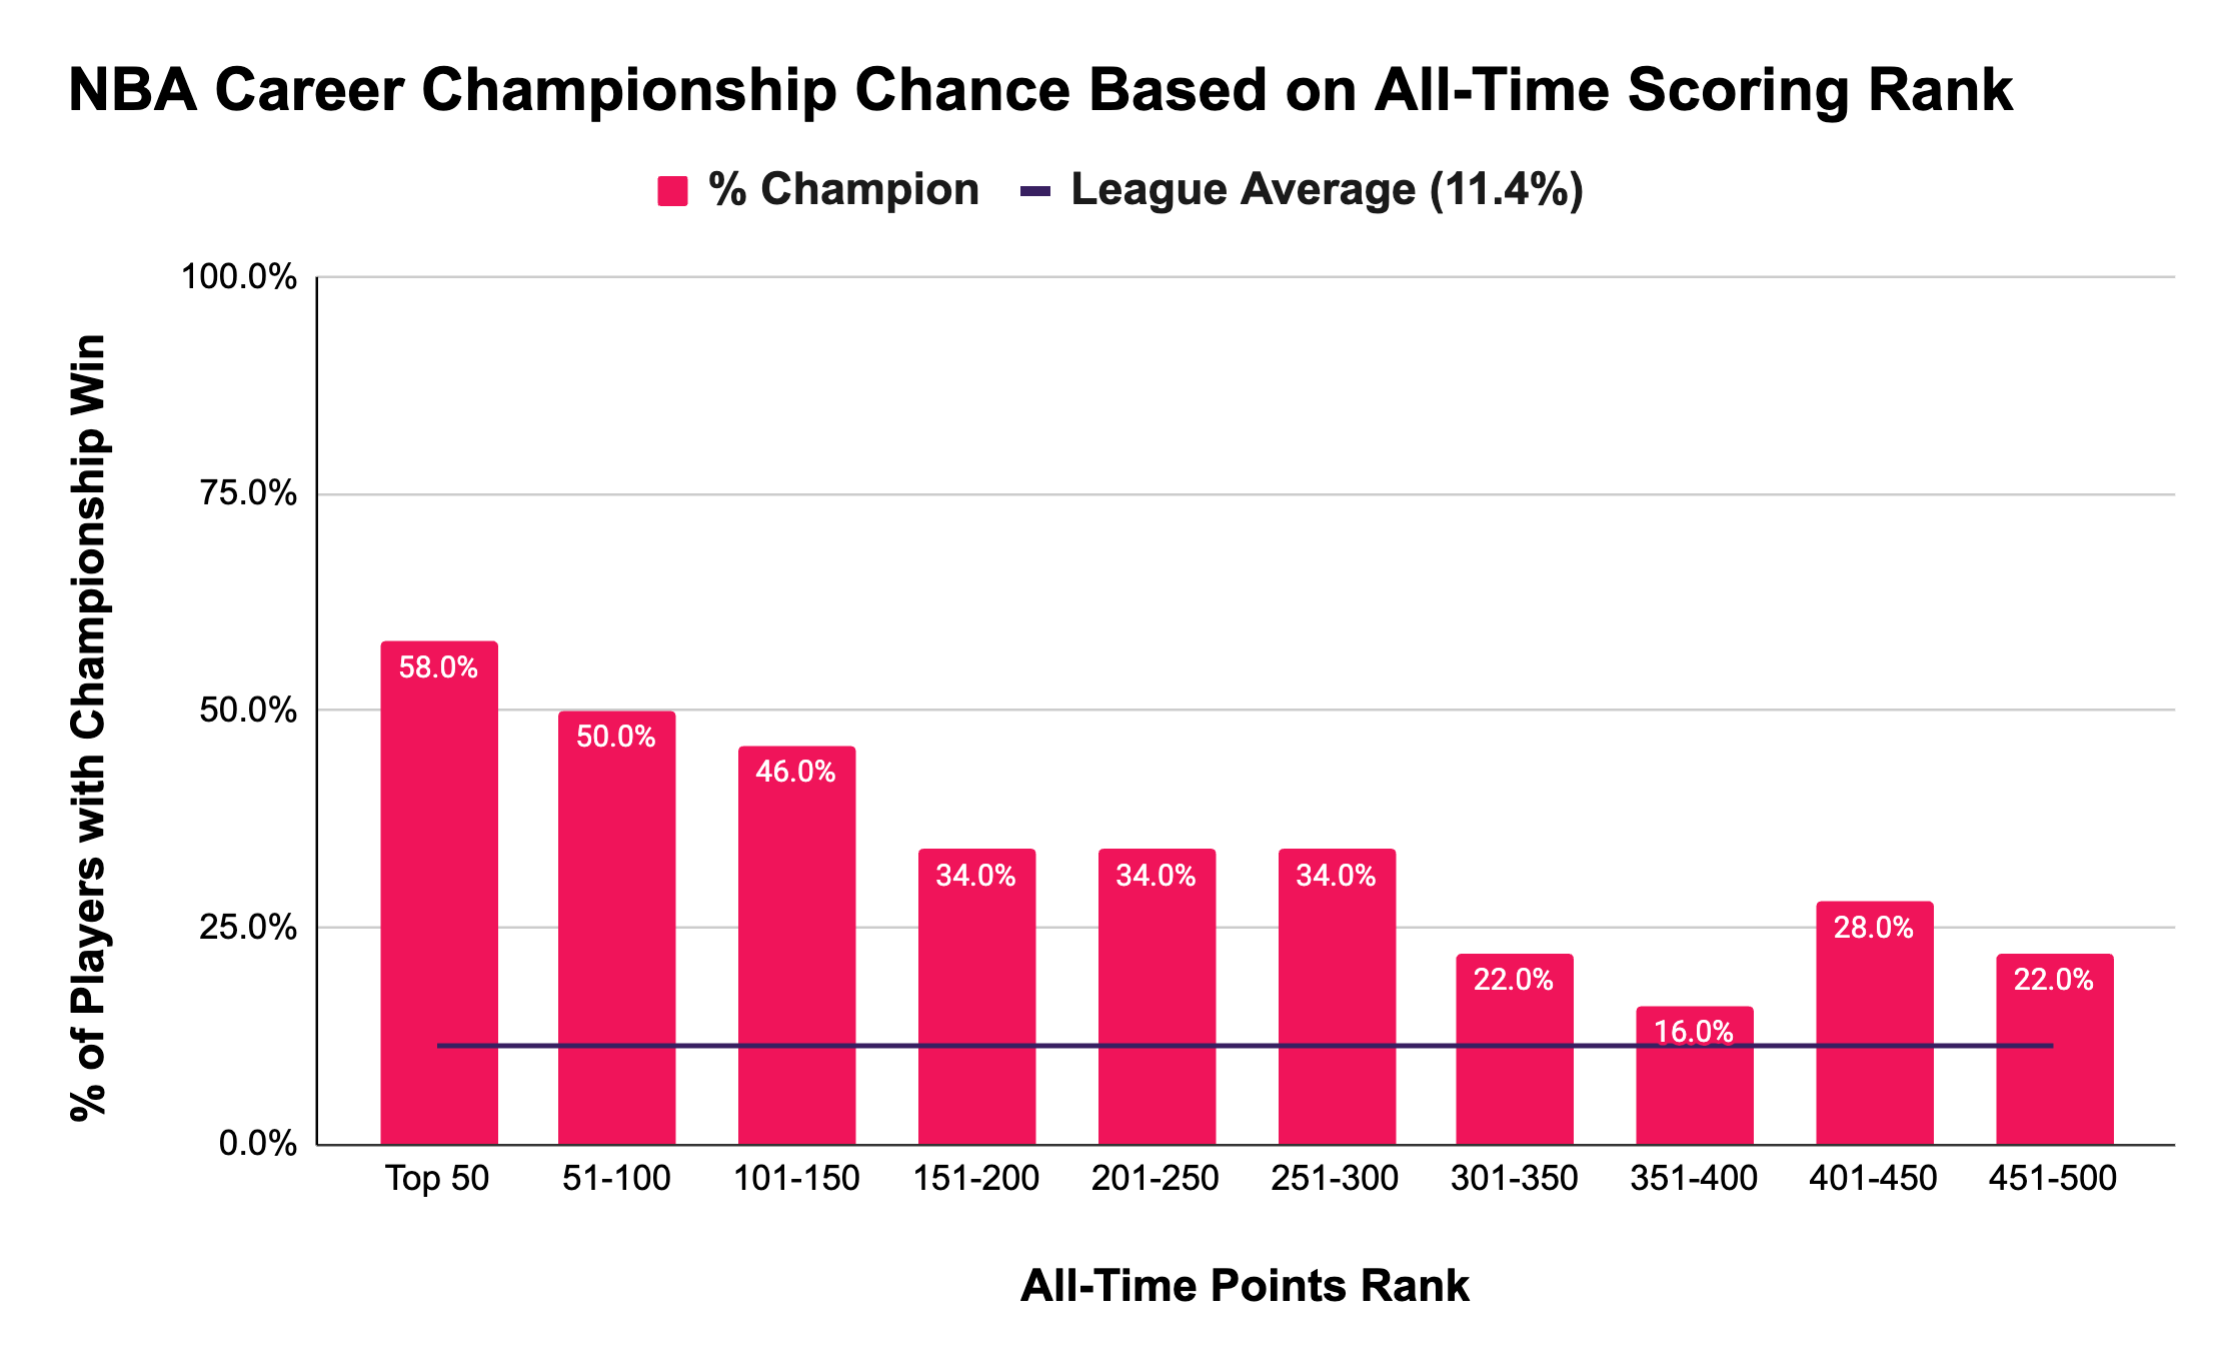
These are some fascinating charts to look at, and I had a few major takeaways:
If you are, or will be, a top-50 scorer in your sport, your chances of winning a championship are above 50%, which is quite significant relative to the baseline odds (more on this in a bit).
In general, your career duration correlates to your place in the all-time scoring list for a sport, so a next-level analysis might involve looking at the career duration for players in each of these buckets to see how well they performed relative to their basic chance of winning each year times the number of years that they played.
Almost across the board, your chances of winning a Stanley Cup are greater than an NBA championship if you are an elite player, which does track with the increased odds of winning in the NHL vs. the NBA in general.
Shockingly, to me at least, if you’re just inside the top 500 players of all time in a sport, your odds of winning a championship relative to the average player are only about 2-2.5x greater, a metric that’s pulled into the next chart below:
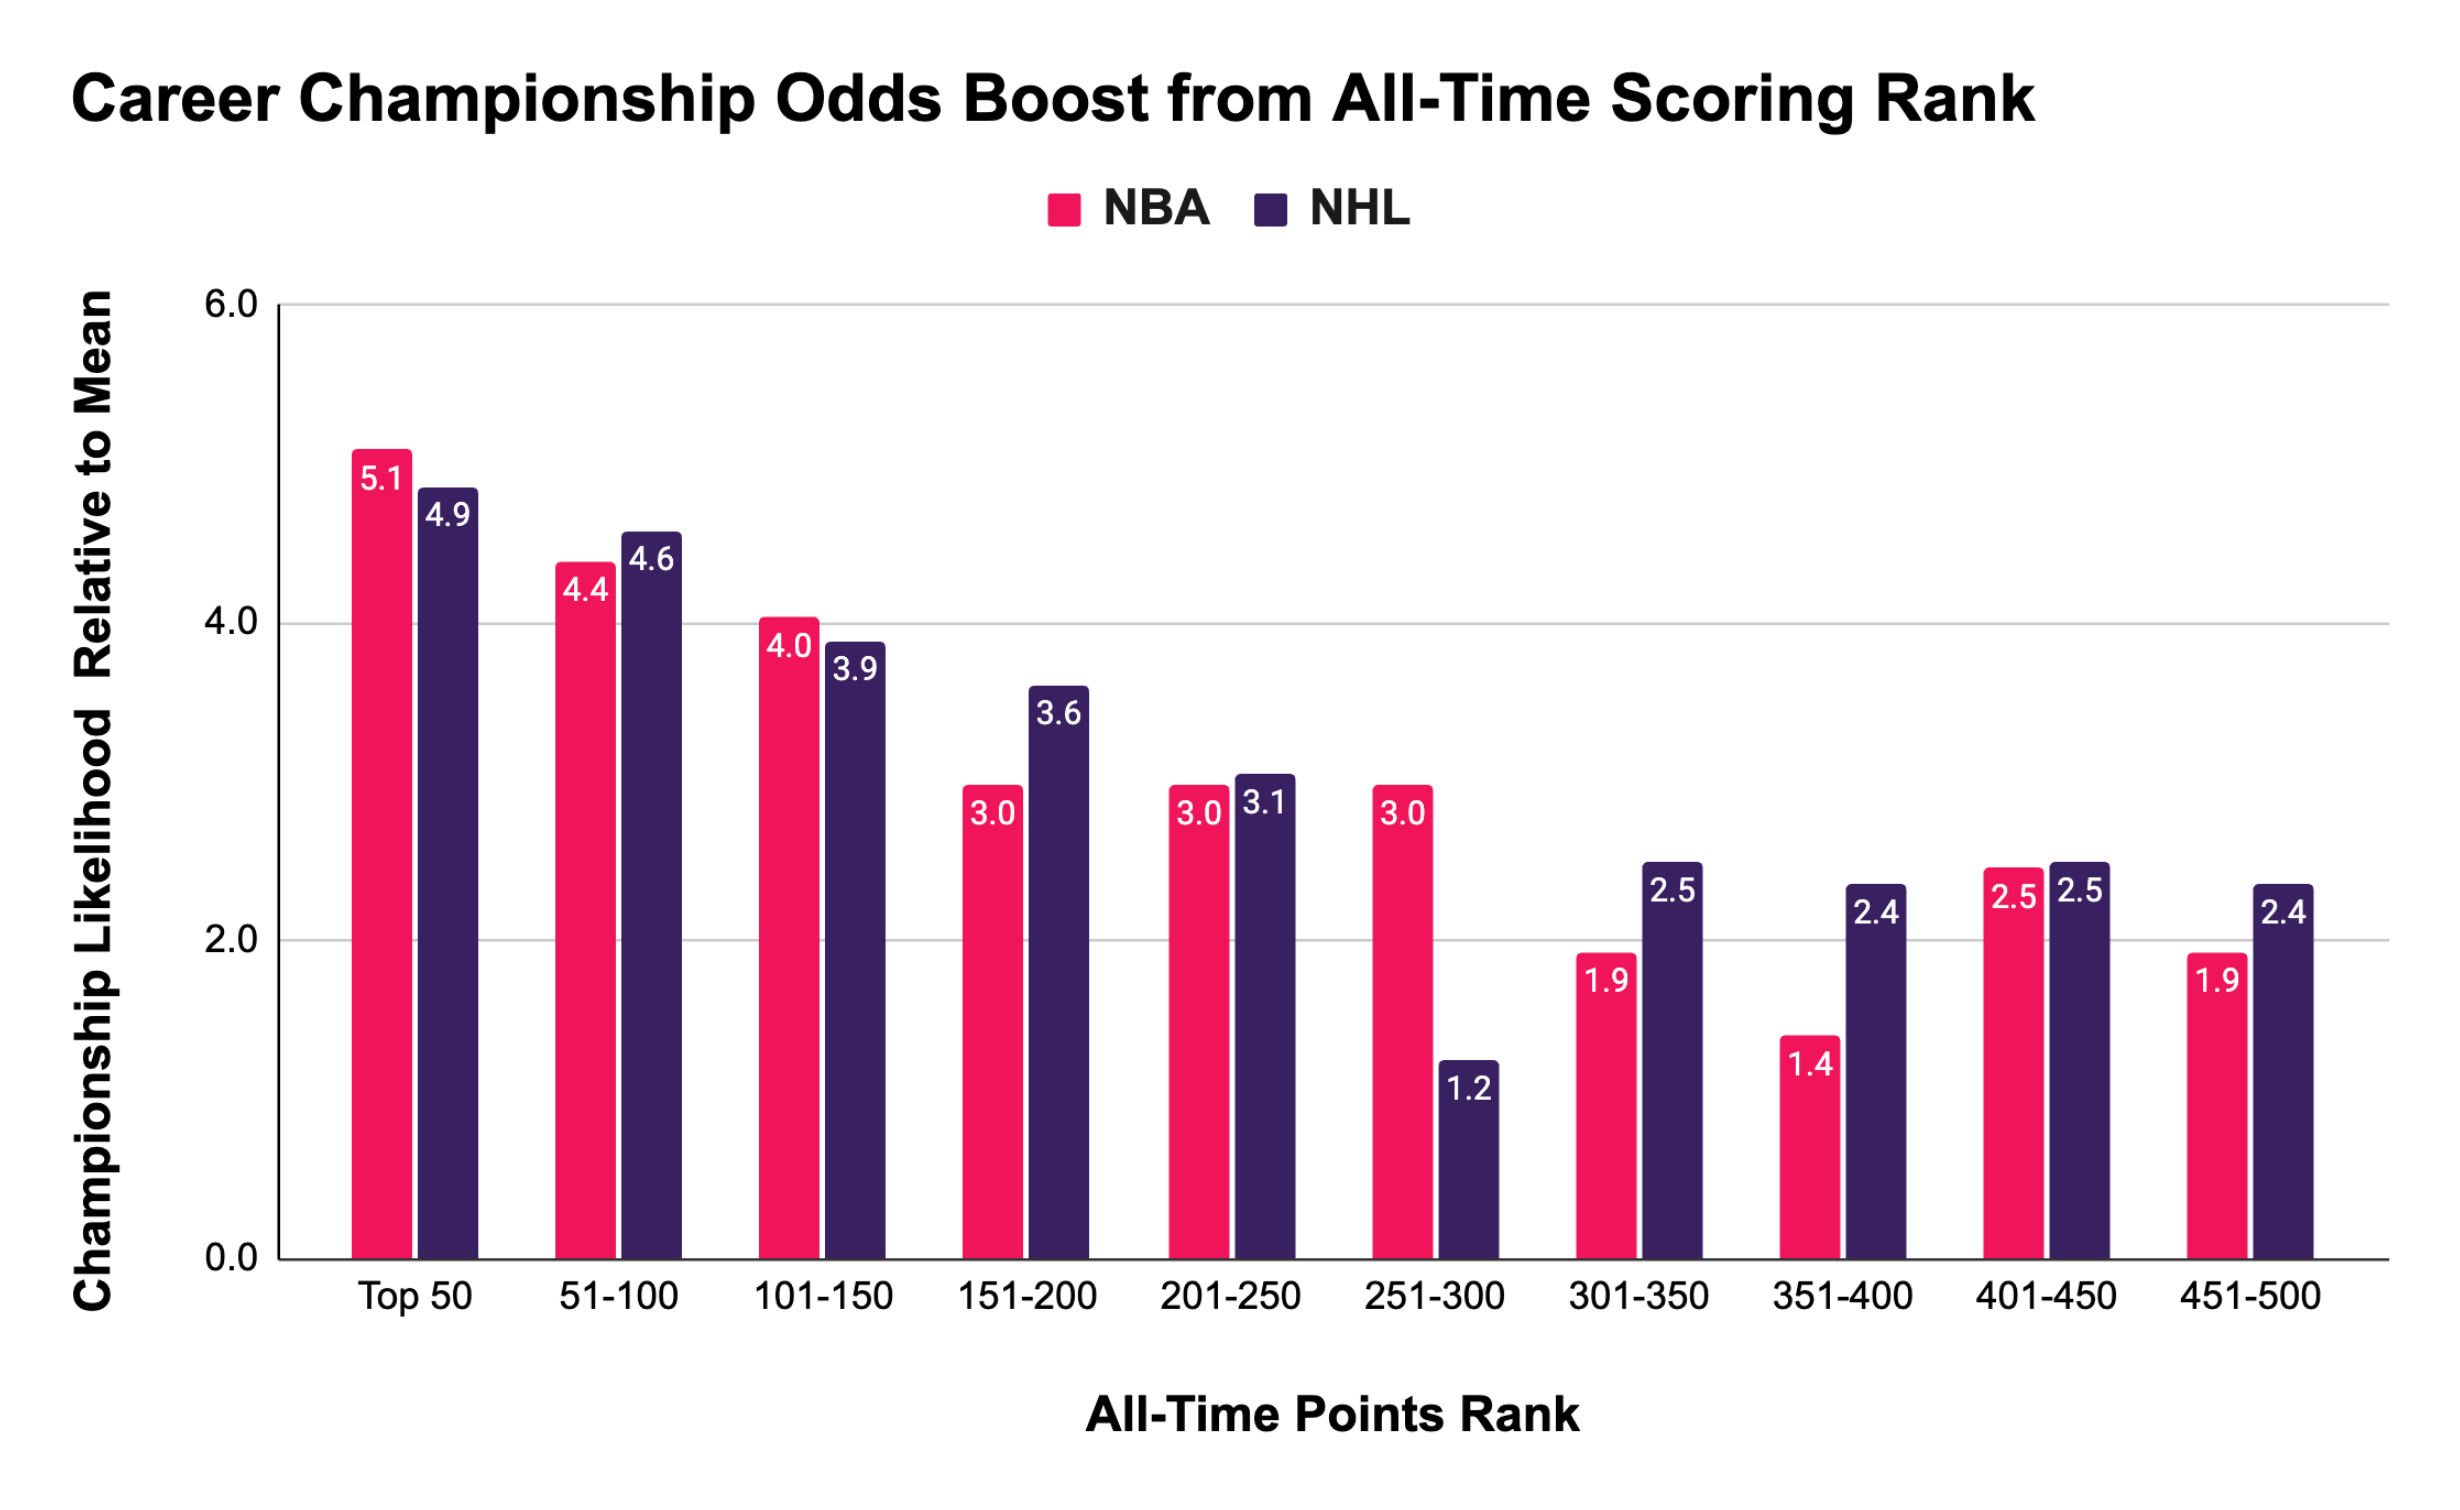
Once you normalize for the baseline chance of winning a championship in each league, the impact of being a top-X scorer in the NHL and NBA are quite similar. In the top-50, you are roughly 5x more likely to win a championship than the average player. If you just squeak into the top 500, you are about 2x more likely to win, which is not as high as I would have expected given the roughly 5,000 NBA and 7,500 NHL athletes who have played in each league. Though, on the other hand, this might reflect the amount of chance that there really is in being a part of a championship organization.
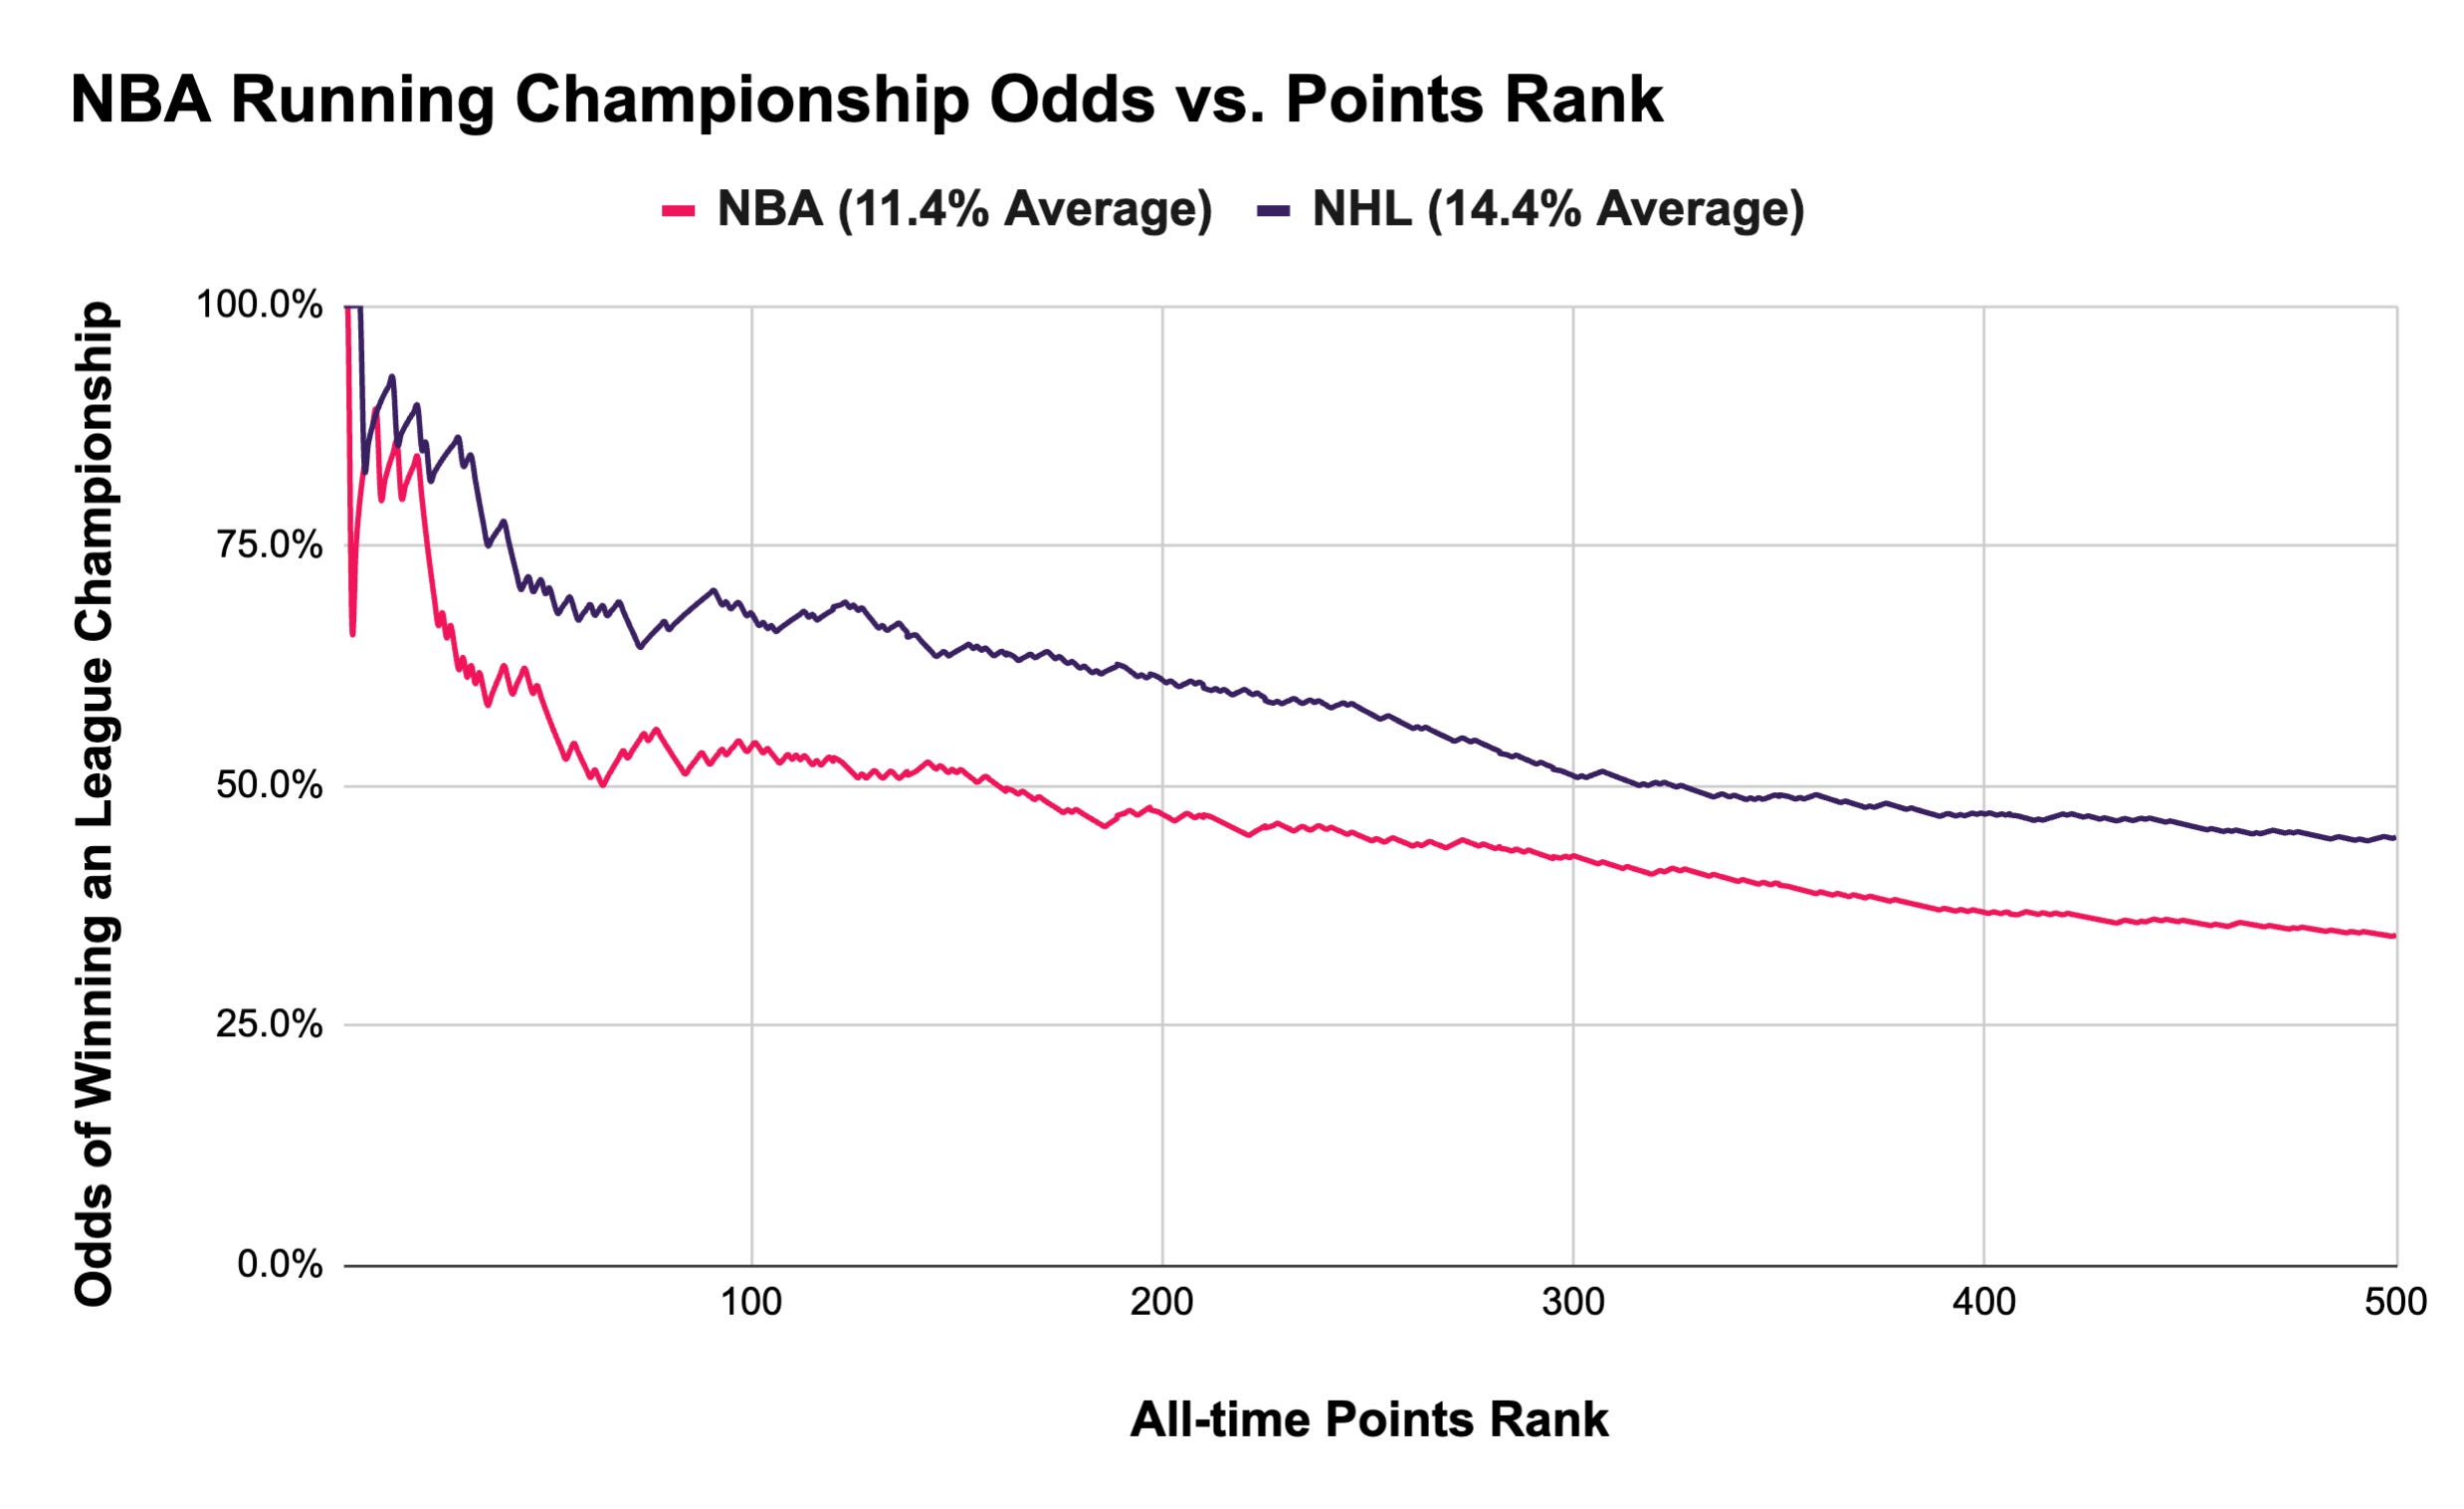
This is also reflected in a “moving-average” plot of the odds of winning a championship. You’ll note that while the NHL odds are better at each point by ~10%, the two trend lines follow very closely with one another. This chart also highlights a segment of athletes not covered above, which is the collection of players vying for “greatest-of-all-time” status in the top 1-25 scorers. These elite-elites have very high chances of winning it all during their career, so if I were a 4th-liner in the NHL or the 11th man in the NBA, I’d try to hitch my wagon to one of these players.
I would be very curious to see at what point your chances of winning a championship pass below the league average. If the linear trends of each of these lines continue, it would likely occur somewhere in the low-thousands on the all-time scoring list, so at about a quarter of the total players to play the sport. I personally don’t think this linear trend would continue though, and there’d likely be a plateauing of the curve similar to a stereotypical Power Law curve (unashamed plug for my previous article). This is another of many areas that could be explored further.
To loop us all the way back to the subtitle and intro paragraph of this article now, I feel as though I can pretty confidently answer the core questions that inspired this article. First, the NFL championship is the most difficult to win in the four major leagues in the US. Only ~1 in 10 players actually hoist the Lombardi Trophy, predominantly due to the short average career of the players in the league. In all major sports leagues, your career chance to win a championship is less than 20%.
Second, being in the top echelon of career scoring for your sport correlates to a higher chance with winning the trophy. If you’re in the top 50 all-time, you are 5x more likely than an average player to hoist the Stanley Cup or the NBA trophy. However, your chances of winning a trophy very quickly regress to the mean if you aren’t one of the top players in history. If you just squeak into the top 500 of all time (i.e. somewhere in the top ~5-10% of all players)you are only twice as likely to win a championship as the average player! It’s a shockingly quick descent to the mean, and I am curious if these players actually perform better than “chance,” or simply played long enough to score more points and have better odds to win a trophy.
The data analysis and visualization opportunities and time requirements for this topic can very easily balloon much more quickly than I anticipated. I think there are some extremely interesting insights to be uncovered when looking at each of these leagues in more depth, and there might also be a business opportunity for someone looking to set up a more comprehensive player database for the major leagues.
I may try to avoid it for the immediate future, but this article may end up having a sequel sometime later this year to flesh out the analysis for the MLB, NHL, and individual positions within each of these leagues. For now, I’m just happy I don’t need to keep scraping 1950’s-era MLB data from the web.
The following season ranges were used as the basis for the championship data for each league, based on availability. As noted, datasets that include more recent seasons would likely show lower championship win %. I was very surprised how difficult it was to either source or create this data from scratch:
MLB: 1947-2016, self-sourced data from Wikipedia
NBA: 1947-2019, sourced from a generous Reddit user who did the work
NFL: 1966-2015, sourced from another generous Reddit user
NHL: Until 2023 (i.e. not including the active season) from The Hockey Writers